Two New Fund Offers

Asset Classes

Equity International Equity Fixed Income Commodity
Indicative Fund Name Motilal Oswal Nifty 500 Fund Motilal Oswal S&P 500 Index Fund Motilal Oswal 5 Year G-Sec ETF ICICI Prudential Gold ETF
Underlying Benchmark Nifty 500 TR Index S&P 500 TR Index (INR) Nifty 5 Yr Benchmark G-Sec Index Gold (LBMA AM fixing prices TRI)
Why Each Asset Class? Domestic Equity - Nifty 500
  • Fastest growing large emerging economy
  • Broadest coverage of entire listed market
  • Diversified across sectors and industries
International Equity - S&P 500
  • Access to world’s largest GDP
  • Exposure to Global brands
  • Captures dollar appreciation vs INR
Fixed Income - 5 Yr G Sec
  • Brings in portfolio stability
  • Practically ‘Nil’ credit risk
Commodity - Gold
  • Safe Haven asset class held by global Central Banks
  • Negative correlation
  • Hedge against inflation
Indicative FoF Allocations
Aggressive FoF 50% 20% 20% 10%
Conservative FoF 30% 10% 50% 10%

Source/Disclaimer: MOAMC Research, The above allocations are indicative; The actual asset allocation may deviate from above target asset allocation in short term but will always remain in the asset allocation range stated in SID. Performance results have many inherent limitations and no representation is being made that any investor will, or is likely to achieve. The above table is used to explain the concept and is for illustration purpose only and should not used for development or implementation of an investment strategy.

Attributes of Fund

Historical Performance - Strategies

image

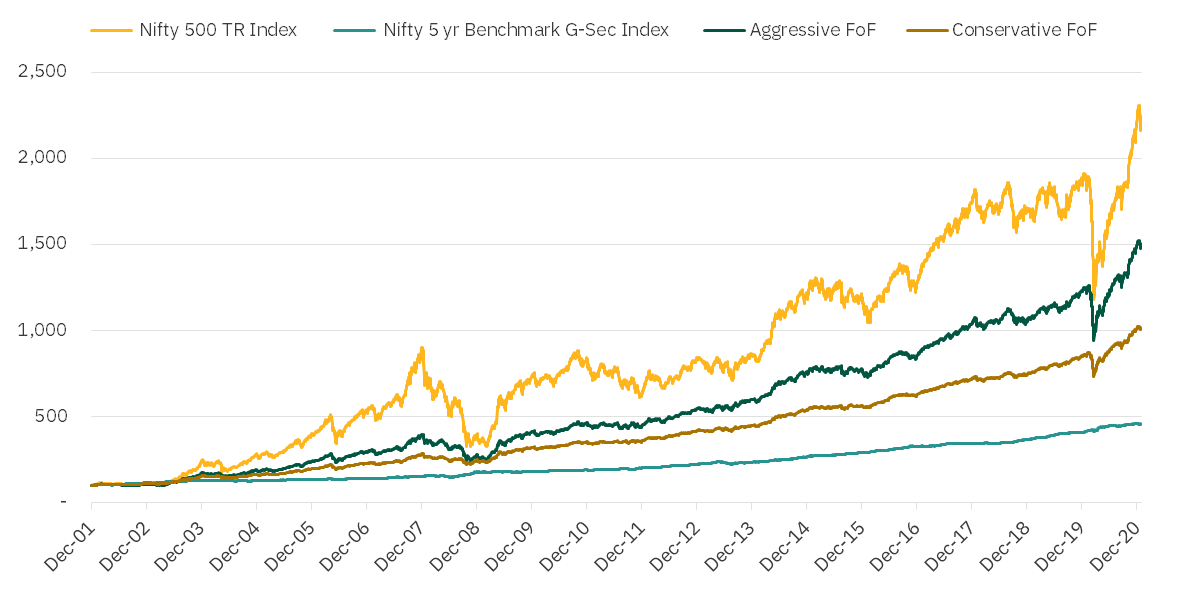
Source/Disclaimer: MOAMC Research, Index values - www.niftyindices.com, MOAMC. Exchange rate- FBIL/RBI/Thomson Reuter. Performance data since 31-Dec-2001 to 31-Jan-2021. Performance for Aggressive FoF and Conservative FoF is simulated using ‘indicative FoF allocations’ mentioned above section. The ‘underlying benchmarks’ used to for hypothetical study with no adjustment for cost. For historical analysis Gold prices denominated in INR sourced from factset. All Performance data in INR. S&P 500 Index values adjusted for one day lag movement due to different time zone. Performance results have many inherent limitations and no representation is being made that any investor will, or is likely to achieve. The above graph is used to explain the concept and is for illustration purpose only and should not used for development or implementation of an investment strategy. Past performance may or may not be sustained in future

Risk-Return Profile

Data Label Nifty 500 TR
Index
Nifty 5 yr
Benchmark G-Sec
Index
^S&P 500 TR
Index (INR)
Gold in INR Aggressive FoF Conservative FoF
Annualized
Returns (CAGR)
1 Year 15.82% 11.15% 21.95% 20.29% 19.76% 17.45%
3 Year 6.48% 10.09% 17.66% 16.70% 11.43% 11.22%
5 Year 13.62% 9.23% 18.18% 12.50% 14.24% 12.36%
Annualized
Volatility
1 Year 29.60% 4.49% 35.05% 19.98% 19.44% 11.73%
3 Year 20.37% 3.45% 23.96% 15.00% 12.92% 7.87%
5 Year 17.59% 3.08% 19.60% 14.45% 10.80% 6.60%

Source/Disclaimer: MOAMC Research, Index values- www.niftyindices.com. Exchange rate- FBIL/RBI/Thomson Reuter. Performance data since 31-Dec-2001 to 31-Jan-2021. Performance for Aggressive FoF and Conservative FoF is simulated using ‘indicative FoF allocations’ mentioned above section. The ‘underlying benchmarks’ used to for hypothetical study with no adjustment for cost. For historical analysis Gold prices denominated in INR sourced from factset. * All Performance data in INR. S&P 500 Index values adjusted for one day lag movement due to different time zone. Performance results have many inherent limitations and no representation is being made that any investor will, or is likely to achieve. The above table is used to explain the concept and is for illustration purpose only and should not used for development or implementation of an investment strategy. Past performance may or may not be sustained in future.

Scheme Details

Downloads

Presentation Leaflet SID Common Application Form & KIM
  Aggressive FoF
Aggressive FoF Download Download Download Download Download
  Conservative FoF
Conservative FoF Download Download Download Download

Frequently Asked Question

  • Asset Allocation is the implementation of an investment strategy that attempts to balance risk versus reward by adjusting the percentage of each asset in an investment portfolio according to the investor's risk tolerance, goals and investment time frame.
  • Asset Allocation is considered as cornerstone of portfolio construction. The goal of asset allocation is to reduce risk through diversification by combining exposures to a variety of investments that have historically performed differently during various market conditions.
  • Keeping in mind risk aversion/risk appetite, the Motilal Oswal Asset Allocation Passive Fund of Fund - Conservative takes more exposure to less volatile asset i.e. Debt unlike the Motilal Oswal Asset Allocation Passive Fund of Fund - Aggressive which takes more exposure to more volatile asset i.e. Equities. The allocation has been provided in the subsequent FAQs.