Motilal Oswal Long Term Equity Fund
(An open ended equity linked saving scheme with a statutory lock in of 3 years and tax benefit)April 2023
Fund Manager |
For Equity Component Mr. Aditya Khemani Managing this fund since 6-Sept-2019 He has overall 14 years of experience For Debt Component Mr. Rakesh Shetty Managing this fund since 22-Nov-2022 He has a rich experience of more than 14 years |
Benchmark: |
Nifty 500 TRI |
Monthly AAUM |
₹ 2,205.36 cr |
|---|---|
Latest AUM (30-Apr-2023) |
₹ 2,236.58 cr |
Market Capitalization |
|
Market Cap |
Weightage (%) |
| Large Cap | 51% |
| Mid Cap | 32% |
| Small Cap | 17% |
Top 5 Stocks |
|
Stocks |
(%) of Holding |
Trent Ltd |
6.0 |
Housing Development Finance Corporation Ltd |
5.9 |
Global Health Ltd |
5.5 |
Titan Company Ltd |
5.2 |
ICICI Bank Ltd |
5.1 |
| Category | ELSS |
| Date of Allotment | 21-Jan-2015 |
| Continuous Offer | Minimum Application Amount : ₹ 500/- and in
multiples of ₹500 /- thereafter. Additional Application Amount : ₹ 500/- and in multiples of ₹ 500/- thereafter. |
| Redemption proceeds | Normally within 2 Business days from acceptance of redemption request. |
| Entry / Exit Load | Entry Load: Nil Exit Load: Nil |
| Total Expenses Ratio | Direct: 0.76% Regular: 1.96% |
Scrip |
Weightage
(%) |
| Equity & Equity Related | |
| Trent Ltd. | 6.0% |
| Housing Development Finance Corporation Ltd. | 5.9% |
| Global Health Ltd. | 5.5% |
| Titan Company Ltd. | 5.2% |
| ICICI Bank Ltd. | 5.1% |
| Fortis Healthcare Ltd. | 4.2% |
| Page Industries Ltd. | 3.7% |
| State Bank of India | 3.6% |
| The Federal Bank Ltd. | 3.6% |
| Cholamandalam Investment and Finance Company Ltd | 3.4% |
| Infosys Ltd. | 3.3% |
| Jubilant Foodworks Ltd. | 3.2% |
| Carborundum Universal Ltd. | 3.2% |
| Axis Bank Ltd. | 3.0% |
| Cummins India Ltd. | 2.9% |
| UltraTech Cement Ltd. | 2.9% |
| Bharat Forge Ltd. | 2.9% |
| IndusInd Bank Ltd. | 2.9% |
| Gujarat Gas Ltd. | 2.8% |
| TVS Motor Company Ltd. | 2.6% |
| Dalmia Bharat Ltd. | 2.3% |
| Gujarat Fluorochemicals Ltd. | 2.2% |
| Religare Enterprises Ltd. | 2.1% |
| Havells India Ltd. | 1.9% |
| Hindustan Unilever Ltd. | 1.9% |
| Crompton Greaves Consumer Electricals Ltd. | 1.9% |
| MedPlus Health Services Ltd. | 1.8% |
| United Breweries Ltd. | 1.6% |
| Divgi Torqtransfer Systems Ltd. | 1.6% |
| JB Chemicals & Pharmaceuticals Ltd. | 1.5% |
| KSB Ltd. | 0.6% |
| Total | 95.2% |
| Net Receivable/Payable | 4.8% |
| Grand Total | 100% |
| Record Date | IDCW perUnit (₹) |
Cum IDCW NAV |
Ex IDCW NAV |
| 26-March-2021 | |||
| Direct Plan | 0.80 |
21.1915 |
20.3915 |
| Regular Plan | 2.20 |
19.3932 |
17.1932 |
| 29-March-2022 | |||
| Direct Plan | 1.61 |
23.4529 |
21.8429 |
| Regular Plan | 1.34 |
19.5270 |
18.1870 |
| 22-March-2023 | |||
| Direct Plan | 1.64 |
23.5512 |
21.9112 |
| Regular Plan | 1.35 |
19.3724 |
18.0224 |
| Pursuant to payment of IDCW, NAV per unit will fall to the extent of the IDCW payout and statutory levy (if applicable). Face value ₹ 10/-. Past performance may or may not be sustained in future. | |||
1 Year |
3 Year |
5 Year |
Since Inception |
|||||
CAGR
(%) |
Current Value of Investment of ₹ 10,000 |
CAGR
(%) |
Current Value of Investment of ₹ 10,000 |
CAGR
(%) |
Current Value of Investment of ₹ 10,000 |
CAGR
(%) |
Current Value of Investment of ₹ 10,000 |
|
| Scheme | 9.6 |
10,956 |
22.7 |
18,446 |
8.3 |
14,911 |
13.0 |
27,508 |
| Nifty 500 TRI (Benchmark) | 4.1 |
10,404 |
25.2 |
19,585 |
11.1 |
16,949 |
10.9 |
23,544 |
| Nifty 50 TRI (Additional Benchmark) |
6.9 |
10,689 |
23.8 |
18,945 |
12.3 |
17,865 |
10.5 |
22,887 |
| NAV (₹) Per Unit (27.5080 : as on 28-Apr-2023) |
25.1084 |
14.9126 |
18.448 |
10.0000 |
||||
Date of inception: 21-Jan-15. Incase, the start/end date of the concerned period is non business date (NBD), the NAV of the previous date is considered for computation of returns. The NAV per unit shown in the table is as on the start date of the said period. Past performance may or may not be sustained in the future. Performance is for Regular Plan Growth Option. Different plans have different expense structure. Mr. Aditya Khemani has been appointed as the Fund Manager for equity component with effect from 6-Sept-2019 vide addendum dated 5-Sept-2019; and Mr. Rakesh Shetty is the Fund Manager for debt component since 22-Nov-2022.
1 Year |
3 Year |
5 Year |
Since Inception |
|||||||||
Scheme |
Nifty 500 TRI |
Nifty 50 TRI* |
Scheme |
Nifty 500 TRI |
Nifty 50 TRI* |
Scheme |
Nifty 500 TRI |
Nifty 50 TRI* |
Scheme |
Nifty 500 TRI |
Nifty 50 TRI* |
|
| Invested Amount | 120,000 |
360,000 |
600,000 |
9,90,000 |
||||||||
| Market Value | 1,26,764 |
1,23,740 |
1,25,330 |
4,43,236 |
4,45,127 |
4,45,256 |
8,29,380 |
8,58,331 |
8,54,658 |
16,62,304 |
17,15,442 |
17,26,052 |
| Returns (XIRR) % | 10.82 |
5.94 |
8.49 |
14.08 |
14.38 |
14.40 |
12.96 |
14.35 |
14.18 |
12.26 |
12.99 |
13.14 |
(as on 28-April-2023) |
||||||||||||
* Also represents additional benchmark
For SIP returns, monthly investment of ₹ 10,000/- invested on the 1st day of every month has been considered. Performance is for Regular Plan Growth Option. Past performance may or may not be sustained in the future.
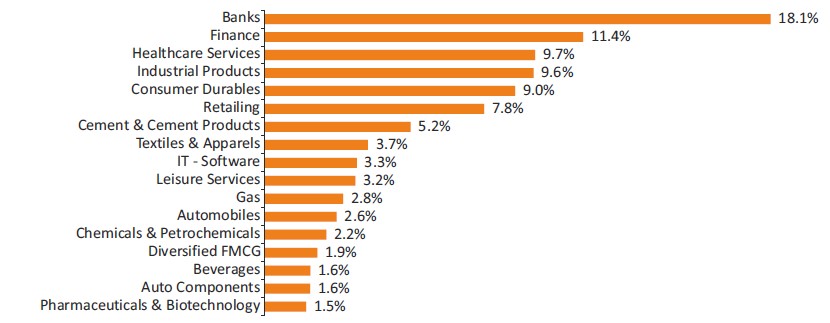
(Data as on 28-April-2023) Industry classification as recommended by AMFI
Beta |
0.9 |
Portfolio Turnover Ratio |
1.6 |
Standard Deviation |
14.9% (Annualised) |
Sharpe Ratio# |
1.1 (Annualised) |
| # Risk free returns based on last overnight MIBOR cut-off of 6.90% (Data as on 28-April-2023) | |
Regular Plan Growth Option |
₹ 27.5080 |
Regular Plan IDCW Option |
₹ 18.7562 |
Direct Plan Growth Option |
₹ 30.6891 |
Direct Plan IDCW Option |
₹ 22.7916 |
| (IDCW= Income Distribution cum capital withdrawal option) | |
- Long-term capital growth
- Investment predominantly in equity and equity related instruments
RISKOMETER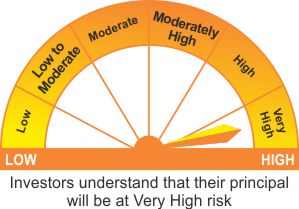 |
| BENCHMARK RISKOMETER Nifty 500 TRI |